CURE
$17,513.83Current value
DRX DLY HEALTHCARE BULL 3X
- Gain/loss
- +$7,018.92
- Quantity
- 150.385
- Cost basis
- $10,494.91
- Avg cost
- $69.79
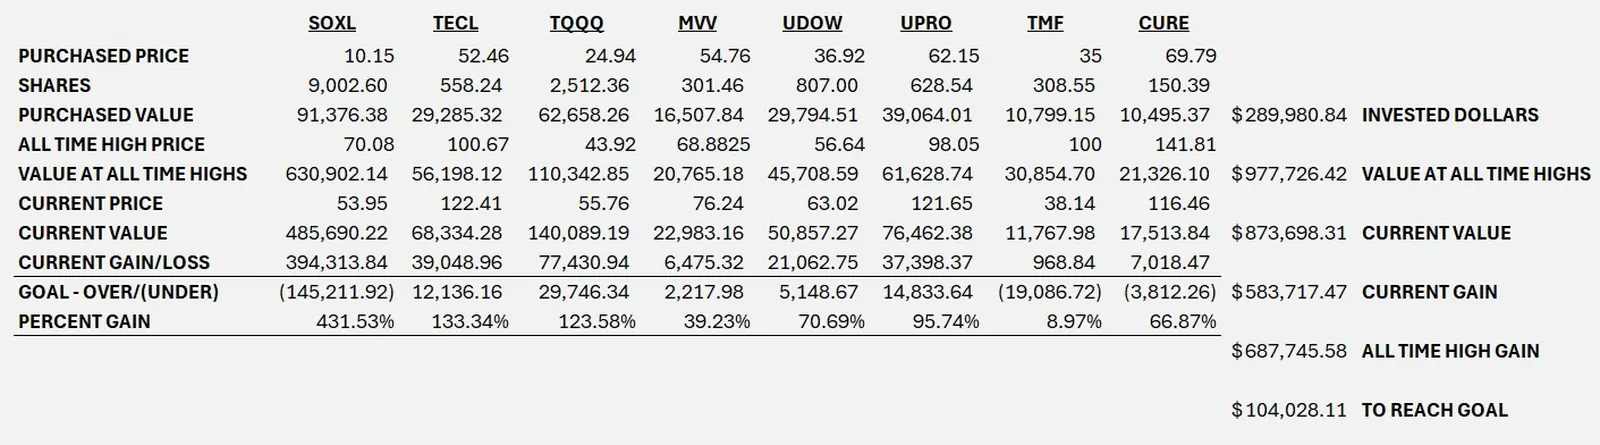
These three money totals are the totals printed on the holdings screenshot. They match the sum of the rows.
8 positions · values in USD
| Symbol | Description | Quantity | Current value | Total gain/loss | Cost basis | Avg cost |
|---|---|---|---|---|---|---|
| CURE | DRX DLY HEALTHCARE BULL 3X | 150.385 | $17,513.83 | +$7,018.92 | $10,494.91 | $69.79 |
| MVV | PROSHARES ULTRA MIDCAP400 | 301.458 | $22,983.15 | +$6,476.20 | $16,506.95 | $54.76 |
| UDOW | PROSHARES ULTRAPRO DOW30 | 807.002 | $50,857.26 | +$21,060.91 | $29,796.35 | $36.92 |
| TECL | DIREXION DAILY TECHNOLOGY BULL 3X SHARES ETF | 558.241 | $68,334.28 | +$39,049.06 | $29,285.22 | $52.46 |
| UPRO | PROSHARES ULTRAPRO S&P500 | 628.544 | $76,462.37 | +$37,397.66 | $39,064.71 | $62.15 |
| TQQQ | PROSHARES ULTRAPRO QQQ | 2,512.36 | $140,089.19 | +$77,367.27 | $62,721.92 | $24.97 |
| SOXL | DIREXION DAILY SEMICONDUCTOR BULL 3X SHARES | 9,002.599 | $485,690.21 | +$394,288.45 | $91,401.76 | $10.15 |
| TMF | DIREXION SHS ETF TR DAILY 20+ YEAR T | 308.547 | $11,767.98 | +$969.31 | $10,798.67 | $35.00 |
| Total | $873,698.27 | +$583,627.78 | $290,070.49 | |||
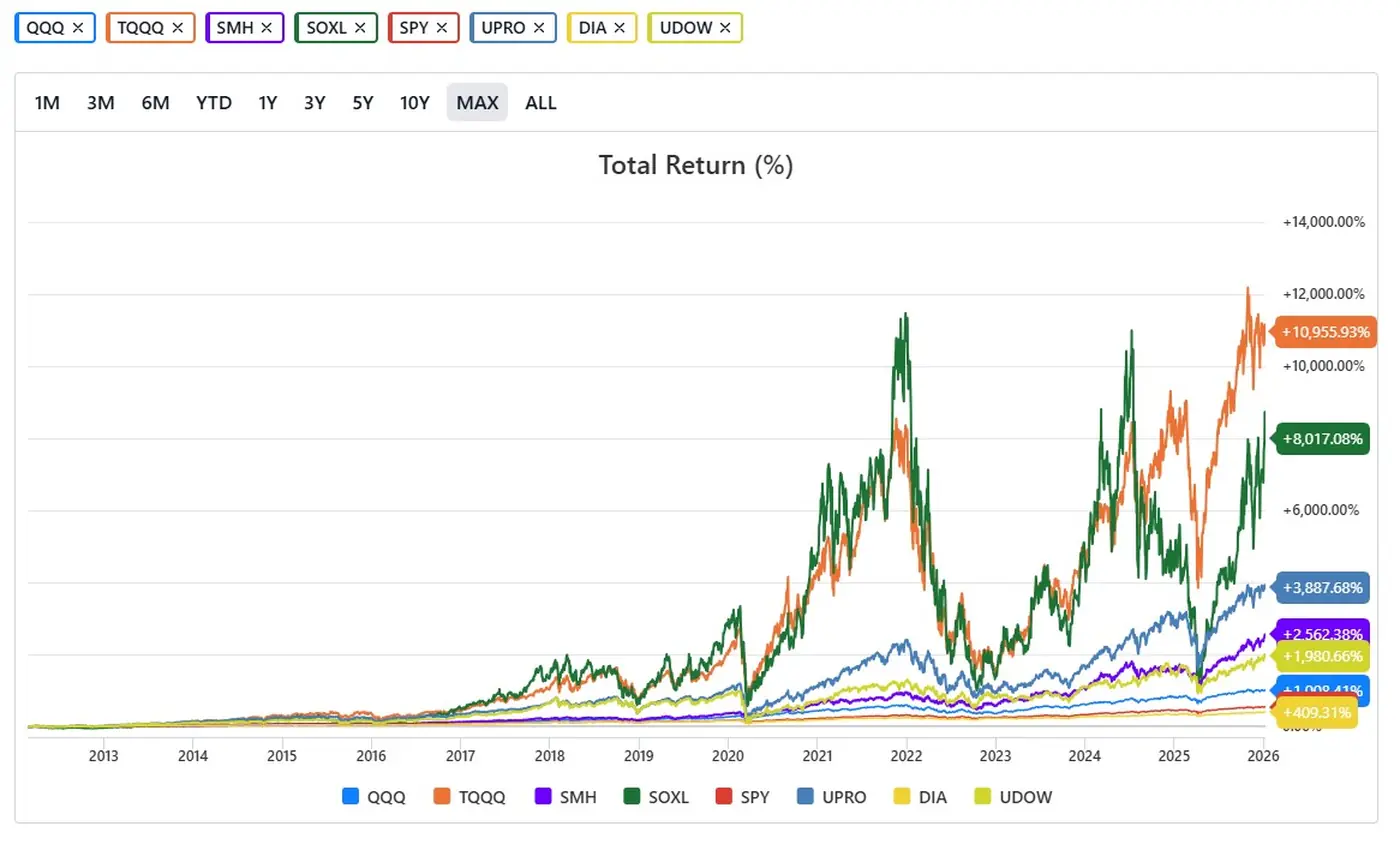
Chart published with the portfolio: QQQ, TQQQ, SMH, SOXL, SPY, UPRO, DIA, and UDOW.
Analytic of my growth portfolio with projection and exit plan.
Not retyped This spreadsheet is the original image. Several cells are too small to read reliably, so it was not turned into a second table and the progress bar from the mock-up is not shown.